insert title
insert caption
Top 20 Features
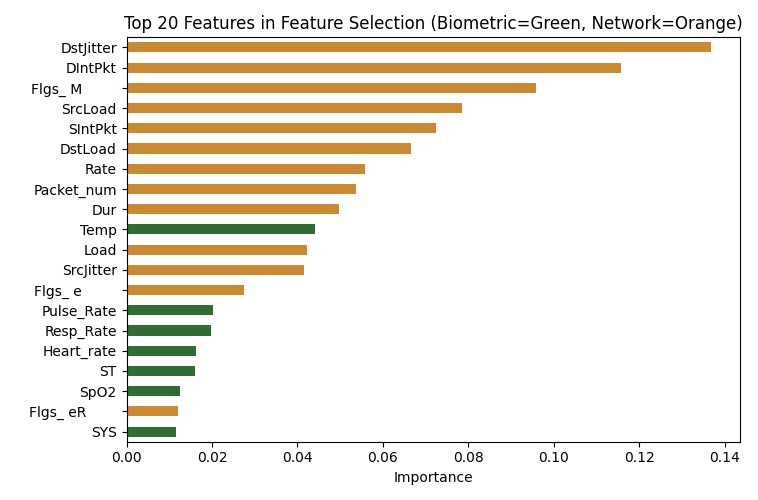
- Of the top 20 features, 13 are network features and 7 are biometric features.
- The top 9 features are all network related, which suggests that network features are usually stronger indicators in classification as normal or compromised
- Biometric features are still significant in classification, as the 7 biometric features of 20 = 35% of the total features.
Confusion Matrix
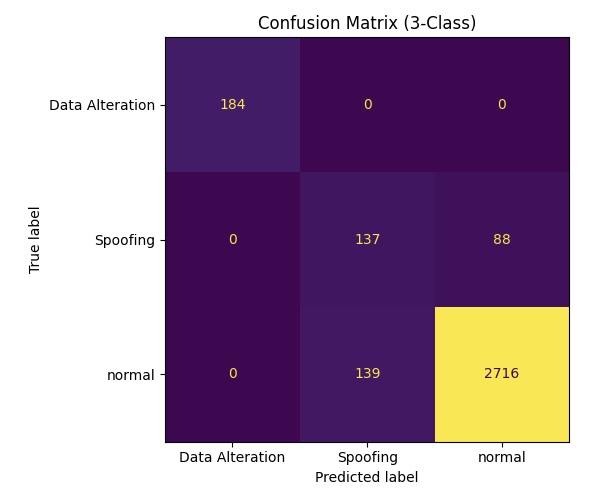
- The Confusion Matrix compares predicted labels to the actual label during our models during the learning phase.
- For example, the title above the yellow is read: “We predicted 88 patients as normal, but in reality they were being spoofed.”
- The total of the patients of diagonal tiles (correct predictions) is 3037. The total labeled patients is 3264. This is 3037/3264 = 0.93%, which is consistent with our accuracy for using both biometric and network features accuracy.
- Interestingly, our model only had confusion with labeling spoofing (spoofing as falsely normal or normal as falsely spoofing), but never confuses Data Alteration with either.
- This suggests that spoofing is difficult to identify since fundamentally the spoofing attack is trying to blend in with normal device behavior.
Furthermore, it implies Data Alteration leaves a distinct signature that separates it from other labels cleanly.
Biometrics and Detection
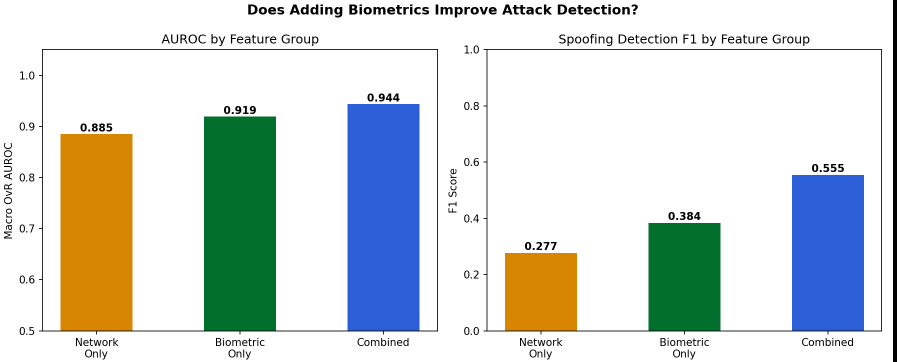
- These bargraphs explore the importance of each different feature.
- Biology actually plays an important role in what kind of attacks they are.
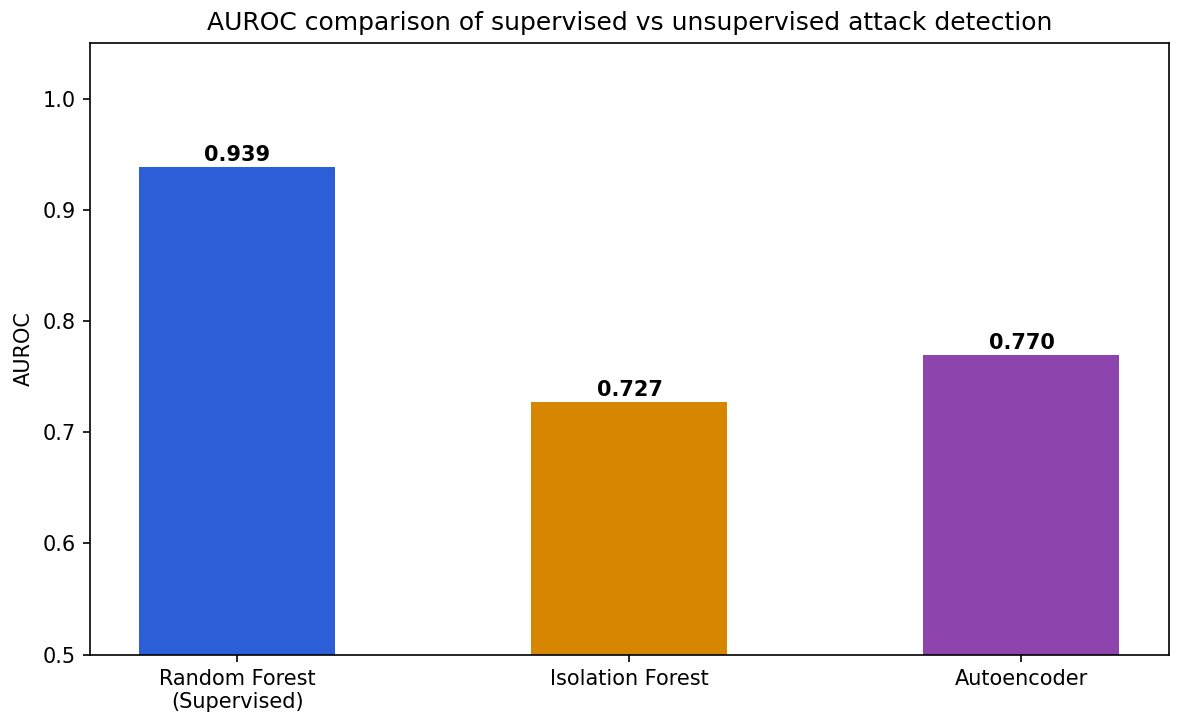
- Although network features dominated the top individual features, when considering network and biometric features isolated respectively as their own groups biometric features are better.
- In both Area Under the Receiver Operator Characteristic Curve (distinguish positive and negative classes across all thresholds) and the Spoofing section, combining both groups of features yields the best accuracy
insert title
insert caption